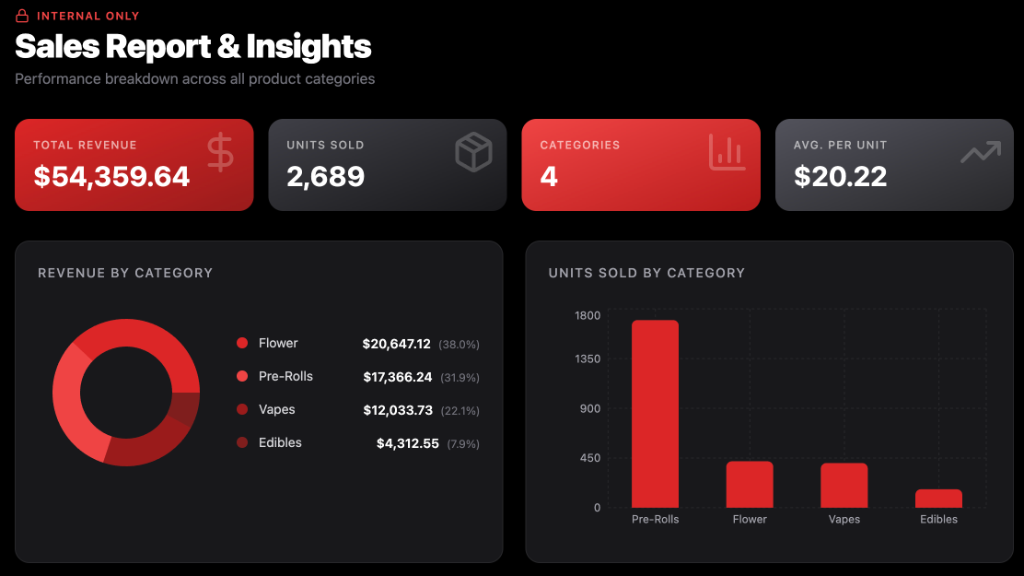
Dispensary sales data becomes useful marketing input only after the team defines the business question, reconciles the reporting period, and separates observed sales from inferred causes. A dashboard can reveal category movement, product velocity, inventory gaps, and campaign timing. It cannot prove that a post, event, or promotion caused a sale unless the measurement design supports that conclusion.
The practical workflow is to clean one export, define a small set of measures, build a decision-focused view, and turn the findings into testable calendar actions. AI-assisted tools can accelerate the interface and analysis draft, but the operator remains responsible for field definitions, privacy, interpretation, and final decisions.
Begin with the decision, not the chart
“Build a sales dashboard” is not a complete assignment. Decide what the team needs to change after reviewing it. A buyer may need to identify products losing velocity. A marketing lead may need to choose which category deserves education. A store manager may need to understand whether a promotion coincided with additional units or simply discounted purchases that would have happened anyway.
Write the decision in one sentence. Examples include:
- Which products need inventory, pricing, placement, or education review this week?
- Which categories changed materially compared with the same-length prior period?
- Which stores or days need investigation because sales and inventory moved in different directions?
- Which campaign hypothesis should be tested next rather than repeated automatically?
The question determines the fields, comparison period, and visual hierarchy. It also prevents a dashboard from becoming a wall of numbers no one uses.
Audit the export before calculating anything
A standard point-of-sale export may include date, store, brand, product, category, units, gross sales, discounts, returns, taxes, and inventory. The labels are not automatically consistent across systems or locations. Confirm what each column means, which timezone applies, whether returns are negative transactions, whether taxes are included, and whether product names changed during the period.
Check for duplicate rows, blank dates, text stored in numeric fields, inconsistent category names, test transactions, canceled orders, and missing stores. Reconcile total sales and units against the source system before building a chart. If the cleaned export does not match the controlling report, stop and resolve the difference.
Keep a short data dictionary with the field, definition, source, owner, and last verification date. “Revenue” may mean gross sales in one report and net sales after discounts or returns in another. A chart title cannot fix an undefined measure.
Protect customer and employee information
Use only the fields required for the decision. Product and period totals often do not require customer names, contact details, loyalty identifiers, or employee information. Remove unnecessary personal data before uploading a file to an analysis or application-building tool, and follow the organization’s approved security and retention process.
Built-in integrations cover file upload, structured-data extraction, and language-model functions. Those capabilities do not determine whether a particular dataset is appropriate. Use sample or minimized data while developing the workflow, then have the responsible security and data owners approve production use.
Define a small set of decision measures
Choose measures that answer the original question. Useful retail measures can include units sold, gross or net sales using the documented definition, average selling price, discount amount, return quantity, inventory on hand, days with zero inventory, and velocity over a consistent period.
Each measure needs a formula and comparison rule. If velocity is units per selling day, decide how out-of-stock days are treated. If average selling price is net sales divided by units, decide how returns and bundles are handled. If the dashboard compares weeks, make sure both periods contain the same number of days and comparable stores.
Do not label the top-selling product “best” without defining the criterion. It may lead in revenue because it has a higher price, in units because it is heavily discounted, or in one store because distribution is wider. State what the ranking represents.
Build the first dashboard around exceptions
The most useful first view usually shows the reporting period, source, last refresh, reconciled totals, and a few comparisons. It should then surface exceptions that deserve action: sharp changes, stockouts, sustained discounting, missing records, or products behaving differently from their category.
In the demonstrated Base44 workflow, a CSV containing brand, category, units, and sales fields was used to create a working dashboard draft. The resulting interface organized totals, category breakdowns, leading items, and slower-moving items. That demonstrates a rapid way to create a reviewable first version; it does not prove the numbers are correct until they are reconciled to the source export.
Use clear labels and include the denominator. “Up 20%” is incomplete without the prior period, store set, unit of measure, and treatment of missing data. Tooltips or a definitions panel can keep the main screen readable while preserving the calculation rules.
Design for investigation
A summary should let the operator move from the signal to the underlying records. If a category declines, the next view should help determine whether the change is concentrated in one product, store, day, price tier, or inventory condition. A dashboard that shows the problem but blocks investigation creates another manual export.
Keep filters purposeful. Date, store, category, brand, and product may be enough for the first version. Add another filter only when it changes a decision the team is prepared to make.
Translate findings into marketing hypotheses
The dashboard should not automatically turn every slow item into a promotion. A decline may reflect inventory, distribution, data quality, seasonality, price, placement, product fit, or awareness. Marketing is one possible response, not the default explanation.
Write each proposed action as a hypothesis:
- If shoppers are unclear about the format, a short education sequence may improve qualified product-page or menu engagement.
- If the product is unavailable in the stores receiving campaign traffic, fix inventory and destination accuracy before buying attention.
- If a discount increased units but reduced net sales without repeat behavior, test a different offer or stop the promotion.
- If one store performs differently under comparable inventory conditions, review placement, staff knowledge, local audience, and operational differences.
Connect retail findings to the retail-marketing plan instead of asking social media to solve every problem. Some findings call for buyer follow-up, menu correction, budtender education, merchandising, or distribution work.
Build a calendar that records the test
A marketing calendar should show why an asset exists, not only when it will publish. For each action, record the hypothesis, audience, market, product, channel role, source data, owner, approval state, destination, launch date, measurement window, and decision date.
For a seven-day test, the sequence might include one retailer-information update, one customer education page, supporting email or social distribution, a store-team reference, and a follow-up review. The exact mix depends on the finding. Repeating the same promotional message across seven days is not a strategy.
The content-calendar guide explains how to keep sources, media rights, links, and approvals attached to the asset. Add the sales-data hypothesis and review date so the content record can be connected back to the business question.
Measure without inventing attribution
A dashboard can show that activity and sales moved during the same period. That is correlation, not necessarily causation. Other promotions, inventory changes, holidays, competitor activity, store execution, and distribution can affect the result.
Use campaign links, landing pages, codes, store groups, or staggered launches where they fit, but state what remains unobserved. For a small retailer test, a clean pre-defined comparison is usually more defensible than a complex dashboard with weak inputs.
Before launch, write the success, failure, and inconclusive conditions. If the team decides what counts only after seeing the chart, the test is vulnerable to wishful interpretation.
Validate the application, not just the spreadsheet
Test calculations with a small file whose totals can be checked by hand. Then test missing columns, duplicate uploads, blank fields, unexpected category values, returns, and a reporting period with no data. The app should explain the error instead of silently producing a partial dashboard.
Review permissions and logs. You remain responsible for your application’s permissions and security settings even though the platform supplies security controls and certifications — so review the permissions and run a security scan before publishing. Restrict access to the people who need the records and document who can upload, edit, export, or delete data.
Check desktop and narrow-screen behavior, downloadable files, filter state, refresh dates, and the path back to the source report. A decision-maker should be able to tell which period and dataset they are viewing without asking the builder.
Create an operating cadence
Assign one owner for data preparation, one for commercial interpretation, and one for campaign execution; small teams may combine roles, but the responsibilities should remain explicit. Refresh the data on a schedule that matches the decision. Daily refreshes create noise when the business only changes inventory or campaigns weekly.
At the review, answer four questions: What changed? What evidence supports the explanation? What action will we take? When will we decide whether it worked? Record the answer in the dashboard or campaign log so the next cycle begins with context.
Connect the system to the broader digital marketing infrastructure. Search, email, social, retail, and web pages can each support a different part of the response, but they should use the same product facts, destinations, and measurement window.
The operating takeaway
Sales data becomes strategy when it changes a defined decision. Reconcile the export, document the measures, surface exceptions, turn findings into hypotheses, and review the result without claiming more attribution than the design supports. AI can accelerate the dashboard and calendar draft; the operator still owns the numbers and the decision.